What is Load Settlement Curve?
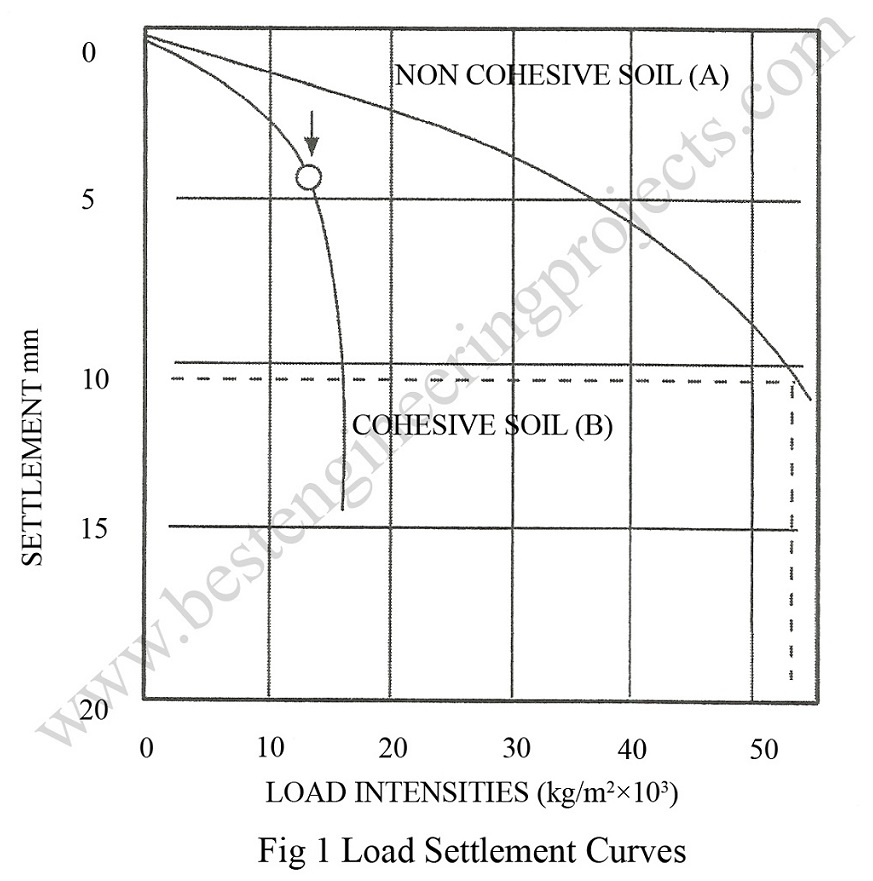
After obtaining the test results, a load settlement curve as shown in Fig.1 is plotted. In the figure, two curves A and B are shown. These two curves represent two different type of soils. The curve A is a typical curve for a sandy soil; non cohesive type, while the curve B is for clayey soil; cohesive type. For sandy soil, the nature of curve is straight in early part and with gradual increase in load intensities, it becomes steeper in later part and the failure is not pronounced. In clayey soil, failure is pronounced and the failure takes place by shear.
Allowable Bearing Capacity
The ultimate bearing capacity for clay or cohesive soil corresponds to the arrow mark shown in curve B. The allowable soil pressure is obtained by applying a suitable factor of safety.
In sands, the allowable soil pressure is governed by settlement criteria. If maximum allowable settlement is known, for a footing of width B, the settlement SP for a plate subjected to the same unit pressure is given by:
![S_p=S_f\left[\dfrac{B_p(B_f+0.3)}{B_f(B_p+0.3)}\right]](https://s0.wp.com/latex.php?latex=S_p%3DS_f%5Cleft%5B%5Cdfrac%7BB_p%28B_f%2B0.3%29%7D%7BB_f%28B_p%2B0.3%29%7D%5Cright%5D&bg=ffffff&fg=000&s=0&c=20201002)
Where, Sp = Settlement of plate
Sf = Settlement of footing
Bp = Width of plate
Bf = Width of footing
The allowable bearing pressure is given by pressure corresponding to the settlement of the plate from the load settlement diagram.